Technical guide by Roberto Ruggeri, forensic audio specialist. Last modified: 23 September 2026
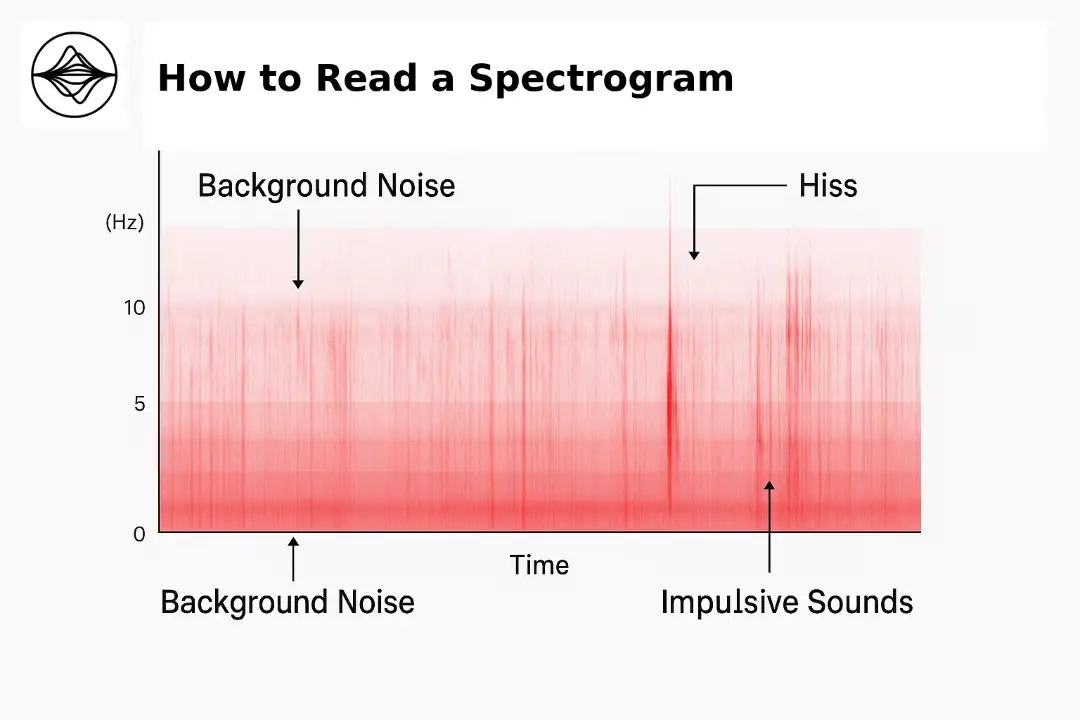
A spectrogram is a time-frequency representation of sound. Time runs horizontally, frequency runs vertically, and color or brightness represents the relative strength of spectral energy at each time-frequency point. The exact quantity and scale depend on the software and display settings, so color should not automatically be read as a calibrated sound-pressure level.
If you want to know how to read a spectrogram, start with three questions: when does the event occur, where is its energy in frequency, and how does that energy change over time? Only after those three points are clear should you interpret visible patterns such as harmonics, broadband noise, transients or changes in background texture.
In forensic audio, a spectrogram is particularly useful for locating and describing features of a recording. It can support listening and other analyses, but a visual pattern alone does not identify its cause and does not prove that a recording has been edited.
How to Read a Spectrogram: Time, Frequency and Spectral Strength
| What to read | What it represents | Practical question |
|---|---|---|
| Horizontal axis | Time, usually in seconds or milliseconds. | When does the sound begin, end, repeat or change? |
| Vertical axis | Frequency in hertz (Hz), with lower frequencies below and higher frequencies above. | Where in the spectrum is the energy concentrated? |
| Color / brightness | Relative spectral magnitude, power or energy according to the software and scaling used. | Which components are stronger or weaker at that moment? |
A waveform and a spectrogram answer different questions. A waveform shows amplitude variation over time but does not directly show where the signal energy lies in frequency. A spectrogram adds that frequency dimension, making tonal components, harmonic structure, broadband noise and short spectral events easier to examine.
How to Read an Audio Spectrogram Step by Step
1. Check the axes and display range
Before interpreting any pattern, confirm the visible time interval and frequency range. A display limited to 5 kHz does not tell you what happens above 5 kHz, and a strongly zoomed view may make a local event look more prominent than it does in the complete recording.
2. Check the spectrogram settings
Window length, window shape, dynamic range, pre-emphasis and frequency scale can materially change the appearance of the same audio. A feature that is faint under one display setting may become more visible under another without any change to the underlying recording.
3. Look at the global pattern before the local detail
First scan the wider recording for stable background texture, repeated tonal components, speech regions, silence, changing acoustic conditions and obvious transitions. Then zoom into the interval of interest. This reduces the risk of interpreting one isolated mark without its surrounding context.
4. Classify what is actually visible
Describe the morphology before assigning a cause. Is the feature narrow-band or broadband? Continuous or impulsive? Harmonic or noise-like? Stable or changing? A forensic description should begin with what can be observed, not with the conclusion one hopes to reach.
5. Compare the image with the audio and neighboring context
A spectrogram is not a substitute for listening. Compare visual findings with critical auditory review and, where relevant, with waveform behavior and documented recording conditions. This is especially important when a visible transition could have more than one technical or acoustic explanation. For the distinction between measurable signal properties and what a listener may perceive, see Human Hearing and Sound Perception.
Common Spectrogram Patterns and What They Can Mean
| Observed pattern | Commonly compatible with | Interpretive caution |
|---|---|---|
| Narrow horizontal line | A relatively steady tonal component, electronic tone, hum component or sustained acoustic source. | The line does not identify the source by itself. |
| Parallel, regularly spaced horizontal lines | Harmonic structure from a periodic source; commonly visible in voiced speech. | Harmonics should not be confused with formants or treated as a speaker identifier. |
| Broad spectral bands in speech | Concentrations of acoustic energy associated with vocal-tract resonances and speech structure. | Their appearance depends strongly on analysis bandwidth and display settings. |
| Short vertical broadband trace | An impulsive event such as a click, impact, switch, plosive release or other short transient. | Morphology alone does not establish whether the event is acoustic, electrical, digital or processing-related. |
| Diffuse broadband texture | Hiss, frication, airflow, static-like noise or other broadband energy. | Several unrelated sources can produce similar broadband appearances. |
| Abrupt change in background texture or bandwidth | A change in acoustic scene, device behavior, transmission, encoding, processing or recording conditions. | An abrupt change is a point for investigation, not proof of an edit. |
When the issue is the technical origin of a click, cutoff, distortion or other defect, the dedicated guide to audio artifacts in forensic recordings addresses those mechanisms in greater depth.
Wideband vs Narrowband Spectrograms: Why Window Length Matters
A spectrogram is calculated from short overlapping portions of the signal. The duration of the analysis window creates a fundamental trade-off: shorter windows improve time resolution but reduce frequency resolution; longer windows improve frequency resolution but blur rapid changes in time.
This is why the same recording can look different in a wideband and a narrowband spectrogram. In speech analysis, a relatively short window can make rapid transitions and broader formant structure easier to see, whereas a longer window can separate individual harmonics more clearly.
As a concrete software example, the Praat spectrogram documentation illustrates this trade-off with a 5 ms analysis window for a broad-band display and a 30 ms window for a narrow-band display. These are useful examples, not universal settings for every forensic task or every program.
The underlying short-time Fourier analysis used for time-varying spectra is a long-established signal-processing framework; a foundational reference is Allen and Rabiner’s 1977 paper on short-time Fourier analysis and synthesis.
Spectrogram Settings Can Change What You See
Interpreting an image without knowing how it was generated can be misleading. At minimum, consider the following display parameters:
- Window length: changes the balance between temporal and frequency resolution.
- Dynamic range: determines how far below the strongest displayed energy weaker components remain visible.
- Frequency range: limits which part of the spectrum is shown.
- Linear or logarithmic frequency scale: changes the vertical spacing of frequencies and can make the same pattern look very different.
- Pre-emphasis or display equalization: can visually strengthen higher-frequency content relative to lower-frequency content.
- Zoom and rendering: affect how much temporal detail is visible and how densely the display is sampled on screen.
For that reason, a screenshot is not a complete measurement record unless the relevant settings and scale are known. When a visual feature is important to a technical conclusion, the analysis should be reproducible from the underlying audio and documented parameters.
How Speech Appears on a Spectrogram
Voiced speech commonly contains a harmonic series produced by quasi-periodic vocal-fold vibration. In a narrowband display, these harmonics can appear as closely spaced horizontal lines. Their spacing is related to the fundamental frequency of the voiced signal.
Vocal-tract resonances shape the spectral envelope and create concentrations of energy associated with formants. In a wideband speech spectrogram, formant regions are often easier to follow as broader bands that change as vowels and surrounding sounds change.
Unvoiced fricatives typically show more noise-like energy, often extending into higher frequencies. Stop releases and other rapid events may appear as short broadband transients. Real speech, however, is continuous and context-dependent: no single visual shape reliably identifies a complete word or sentence.
If a weak or degraded passage seems to form words only after repeated or suggested listening, the separate issue of auditory pareidolia in ambiguous recordings becomes relevant. A spectrogram can describe acoustic structure, but it does not convert an uncertain listening impression into demonstrated verbal content.
What a Spectrogram Can Show in Forensic Audio
In forensic work, spectrograms are useful for documenting the distribution and continuity of recorded energy over time. Depending on the material and question, they can help to:
- locate short transients or regions requiring closer examination;
- compare the continuity of background or tonal components;
- visualize speech, noise and periodic structures;
- identify changes in spectral texture or bandwidth that need an explanation;
- illustrate findings that have also been examined through listening or complementary analyses.
The current ENFSI Best Practice Manual for Digital Audio Authenticity Analysis treats waveform and spectrogram analysis as visual methods that can verify and supplement auditory findings and should be considered together with contextual information.
This is also why the site’s forensic audio methodology separates observation, interpretation and conclusion rather than allowing one graphical feature to stand as a complete forensic opinion.
Can a Spectrogram Reveal an Edit or Manipulation?
A spectrogram may reveal a discontinuity, spectral gap, abrupt transition or unusual change that deserves further examination. What it cannot do, by itself, is establish the cause of that feature.
A visible discontinuity may be compatible with editing, but it may also arise from an acoustic event, microphone handling, automatic device behavior, transmission loss, codec effects, level changes, re-recording or other ordinary parts of the recording chain. The relevant alternatives depend on the actual file and its known history.
If the technical question is whether a recording contains cuts, splices, insertions or other post-recording modification, the appropriate examination is audio authentication. The spectrogram can contribute to that examination, but it is not a stand-alone authenticity test.
Common Mistakes When Reading Spectrograms
- Treating color as an absolute level. Display color is usually relative to the software’s scale and settings unless a calibrated measurement procedure states otherwise.
- Using only one window setting. A feature blurred in time may become clearer with a shorter window; closely spaced tones may separate better with a longer one.
- Assigning a source from shape alone. A vertical broadband mark is an observation; “digital splice”, “impact” or “electrical click” are competing explanations that require evidence.
- Ignoring the surrounding recording. Local analysis without preceding and following context can make normal transitions look anomalous.
- Assuming a bandwidth cutoff identifies a codec or edit. Codec history and re-encoding require a broader technical assessment; see codec lineage in forensic audio.
- Replacing listening with the image. Visual and auditory analysis are complementary, not interchangeable.
Scientific and Forensic References
- Allen, J. B. & Rabiner, L. R. (1977). A Unified Approach to Short-Time Fourier Analysis and Synthesis. Proceedings of the IEEE, 65(11), 1558–1564. DOI: 10.1109/PROC.1977.10770.
- Praat — Configuring the Spectrogram. Technical documentation on window length, bandwidth, dynamic range and the time-frequency resolution trade-off.
- ENFSI — Best Practice Manual for Digital Audio Authenticity Analysis, FSA-BPM-002, Issue 001. Guidance on visual and auditory analysis, recording traces, discontinuities and contextual interpretation.
- SWGDE — Best Practices for Forensic Audio, 08-A-001-2.5. General best-practice framework for handling and examining forensic audio.
Scope note: This guide explains how to read and interpret spectrogram displays. It does not provide an authenticity conclusion, identify a speaker, establish the words in an ambiguous recording or determine legal admissibility. Those questions require the appropriate case-specific examination and, where relevant, the applicable legal framework.